The SHELDON Dataset
A comprehensive and dynamic
USG knowledge graph.
Harmonizing hundreds of open, proprietary, and customer-furnished sources into a single, transparent mirror of government activity. Designed for deep exploration and instant insight.
Secure & Transparent
Serverless hosting options and architectures designed for sensitive customer environments, with bottom-up data approach and source tracing.
Customizable Outputs
Package your intelligence as interactive dashboards, curated CSV datasets, or direct API integrations. Open source tools enable custom development and rapid time-to-deploy.
Data Integrity
Millions of open source data points unified into a dynamic, explorable database. Drill down into every record using interactive outputs for maximum visibility.
The SHELDON Dataset
Visualizating the complex web of federal funding, government-funded entities, federal budgets, agency relationships, and more.
Federal outlays
Expenditures at the prime and subcontractor levels of all types, traditional and nontraditional.
Policy documents
Thousands of pages of policy documents including DoW Directives.
Entity information
Detailed data on millions of recipients of federal funding at the prime and subcontractor levels, including companies, nonprofits, and consortia.
Customer-furnished data
Unclassified datasets furnished by customers.
Budget documents
Millions of pages of budgetary information including OMB data, RDT&E data, specific DoW budget data, and more.
Open & archived solicitations
Millions of active and archived solicitations including RFPs, RFIs, BAAs, and CSOs.
Interactive Dashboards
Core Technology Areas (CTAs)
SHELDON doesn't just store data; it understands it. By analyzing frequency, sentiment, and funding velocity across millions of documents, we surface emerging technology trends before they become mainstream.
The visualization to the right demonstrates part of a fictional portfolio analysis for a client. Each data point represents a cluster of activity related to specific keywords in our taxonomy, showing how government investment shifts over fiscal years.
Granular Visualizations
Award totals by topic will appear here once data is available.
Historic & future government funding
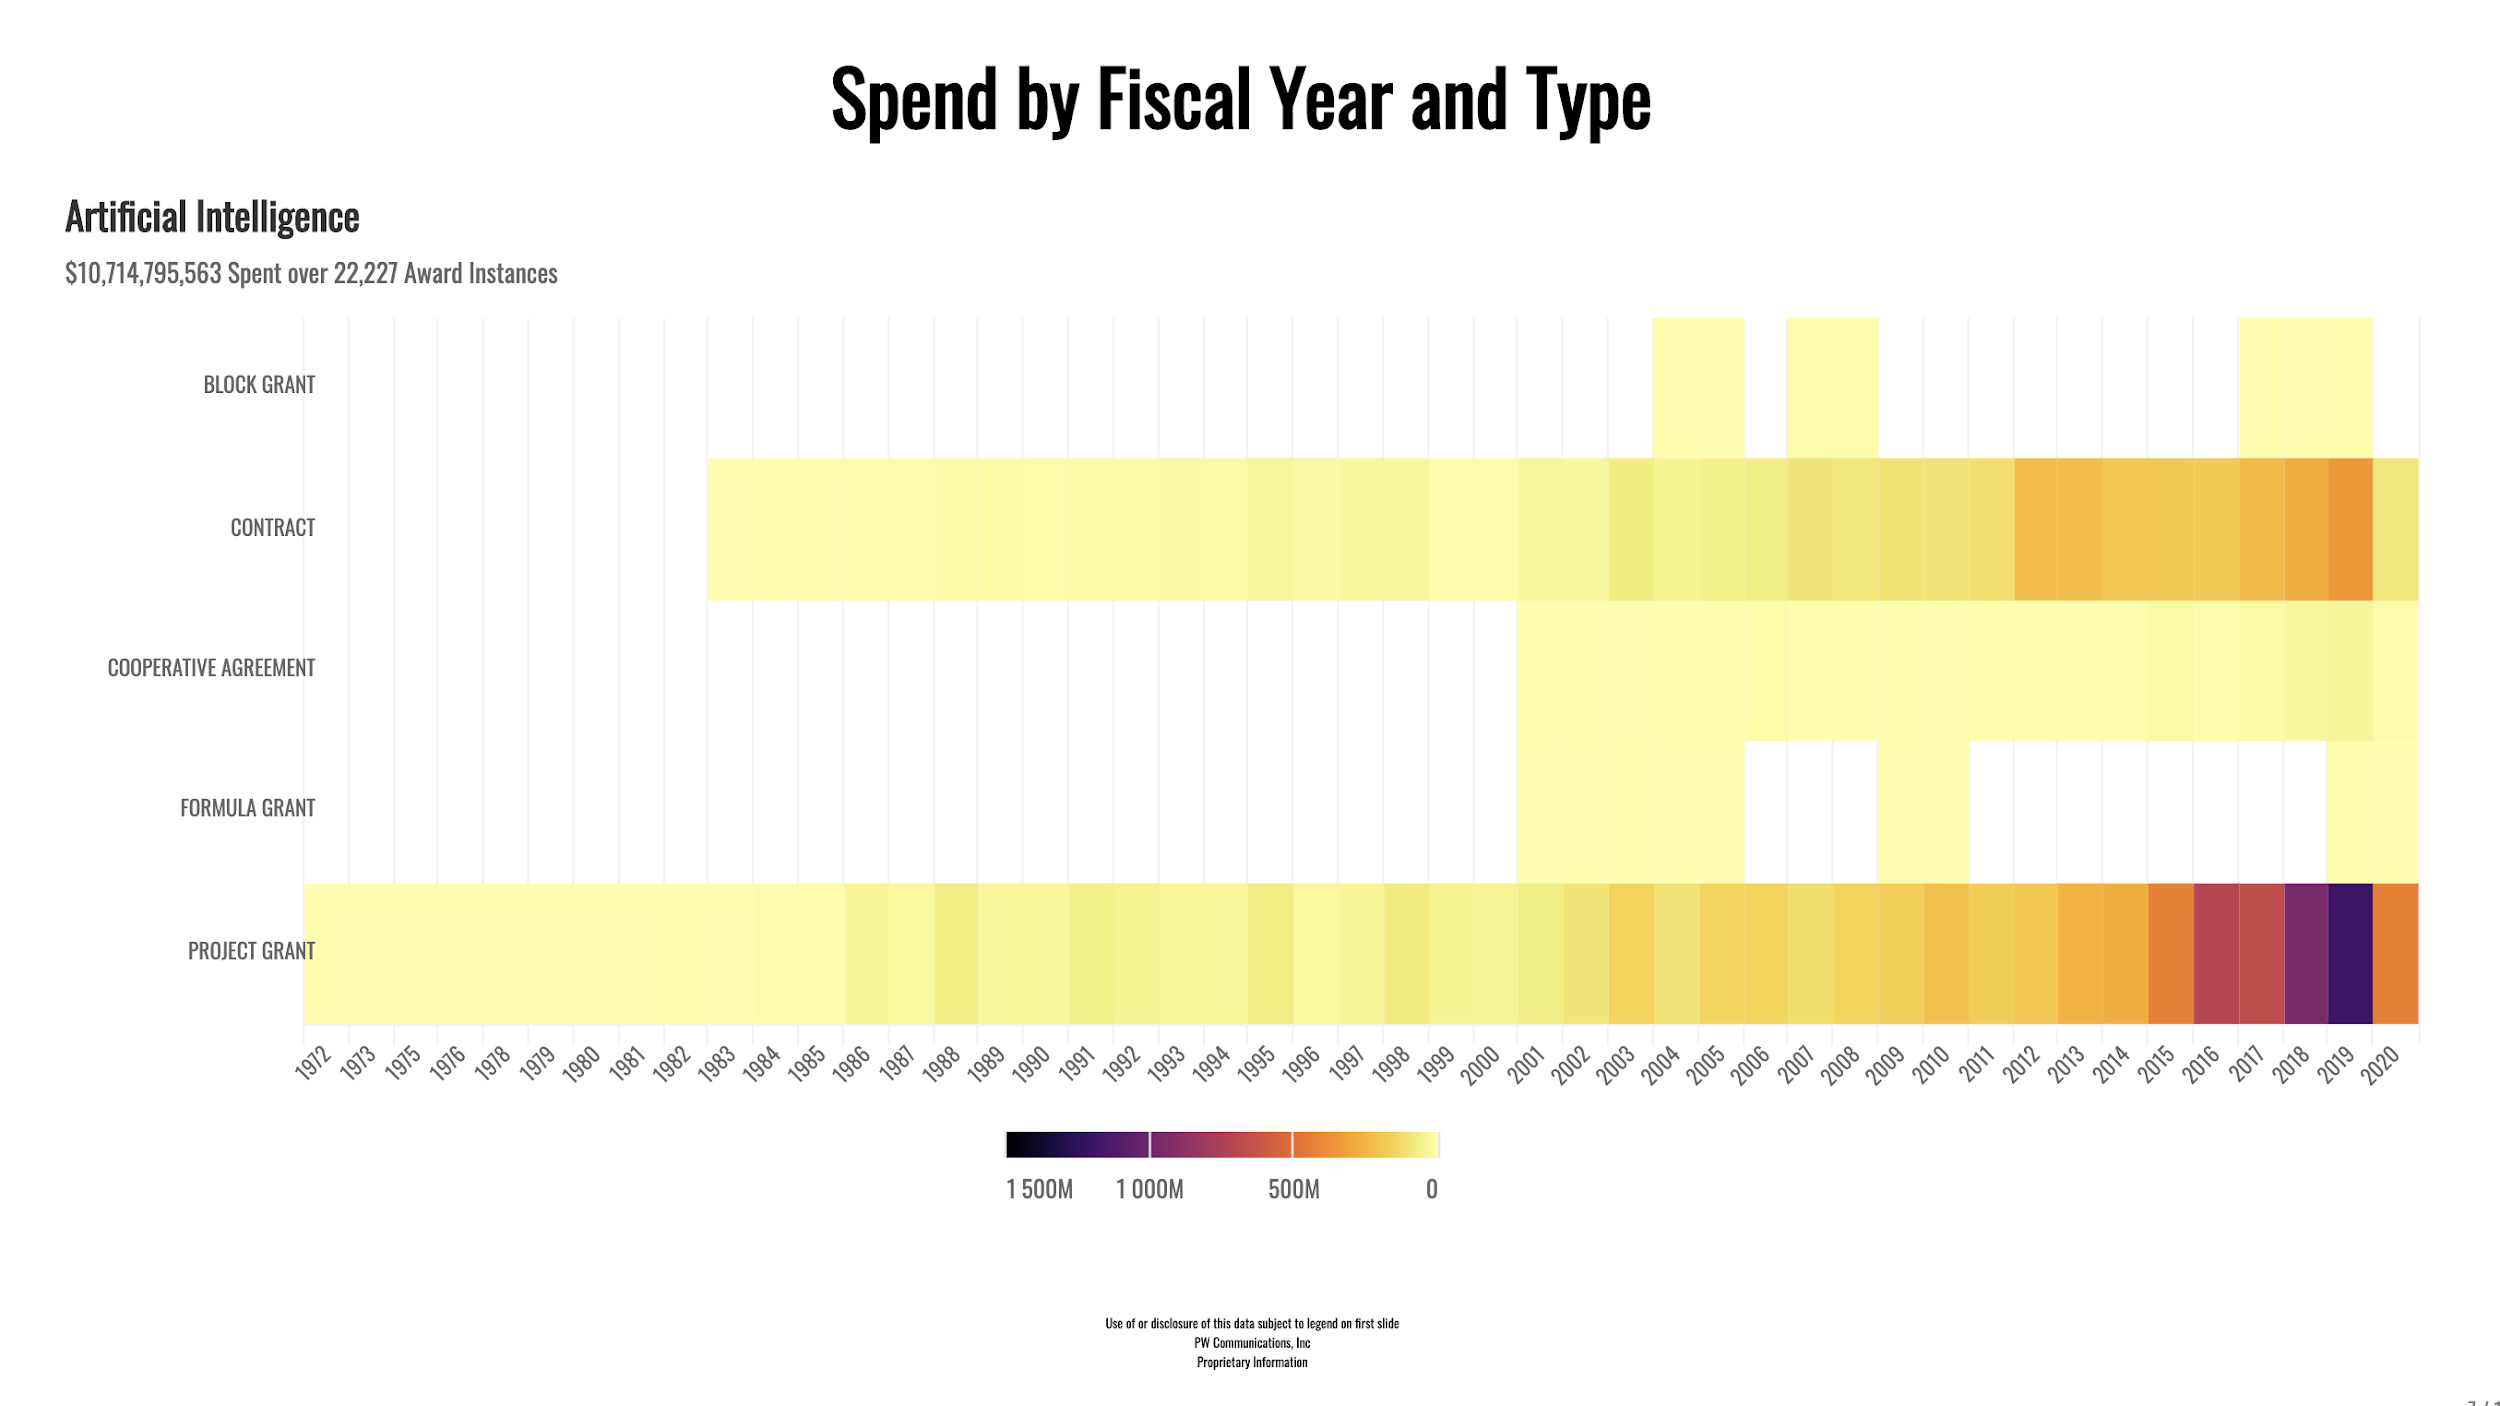
Federal Spend Reports
Provides deep-dive investment analysis across any product, service, or concept area. By tracking flows from appropriation to obligation, we help you measure policy impact and identify transition pathways.
- > Analysis of historic & future USG investment
- > Supports coordinated decision-making across agencies
- > Deliverable: 120+ interactive views & executive summary
Granular queries
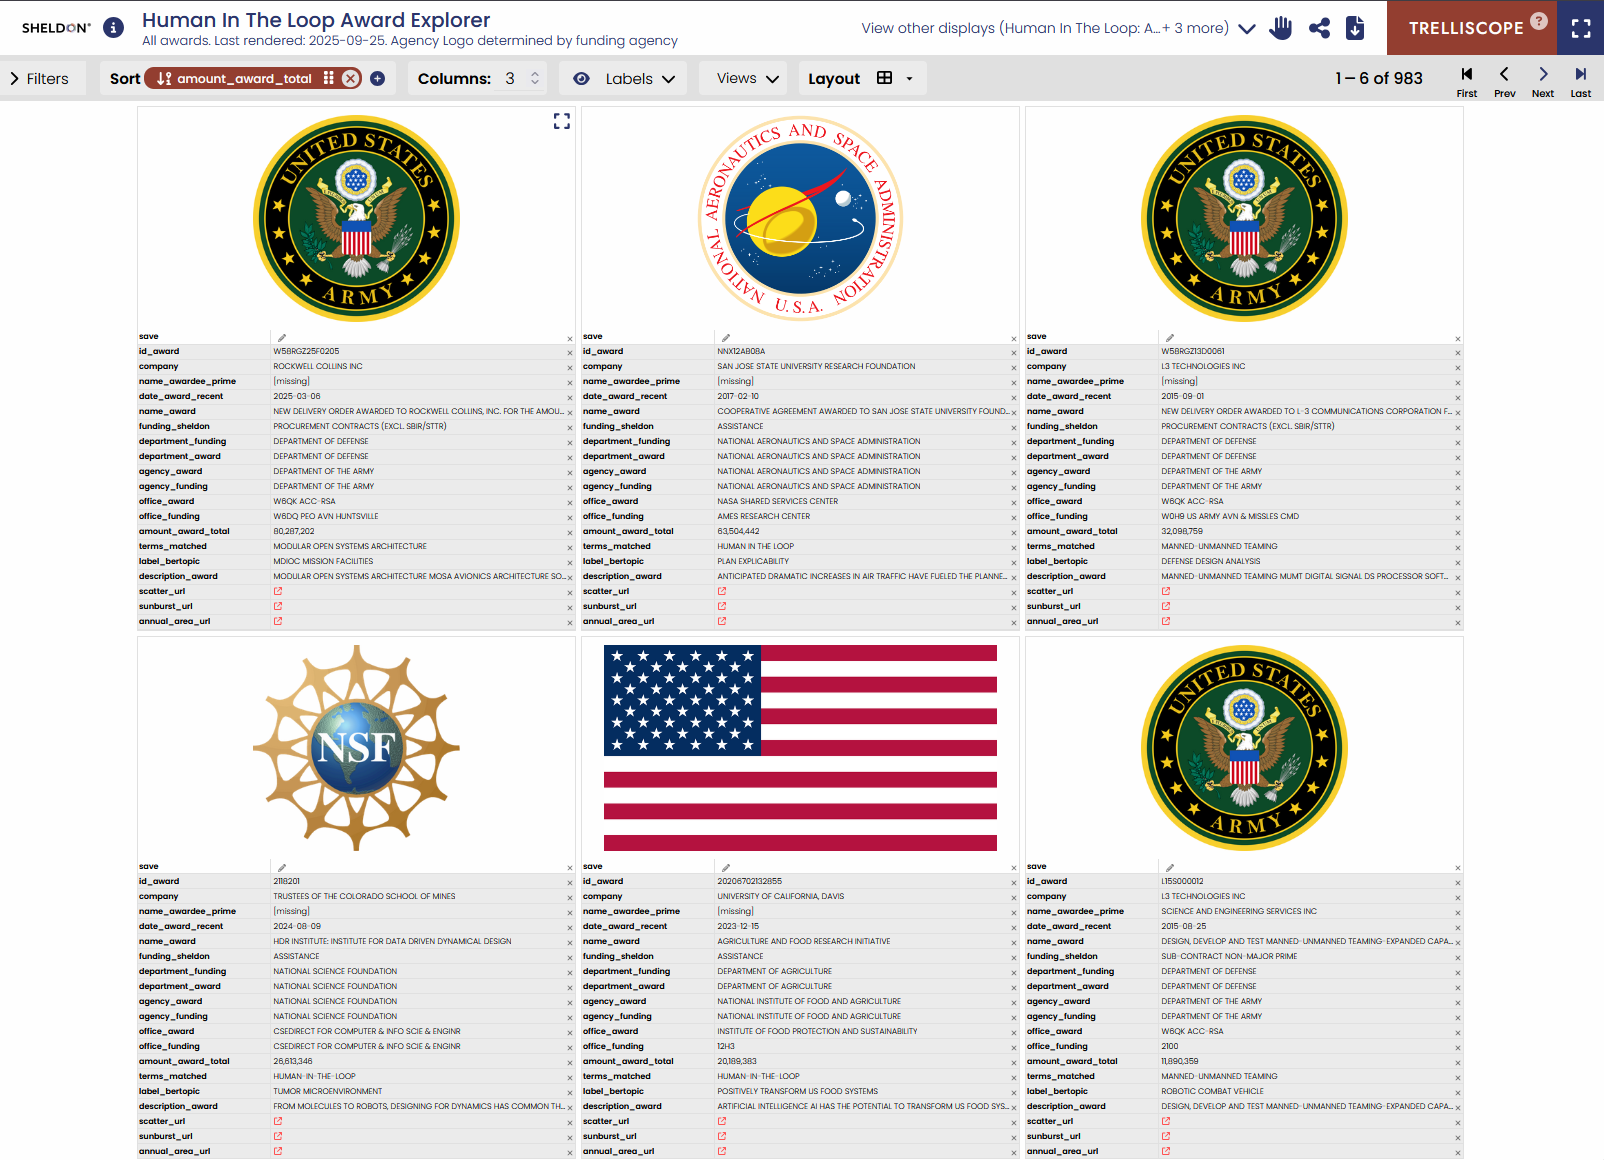
Trelliscope Dashboards
Move beyond static slides with custom interactive dashboards. Trelliscope allows you to filter, sort, share, and annotate millions of data points in a scalable, intuitive interface.
Explore any subset of the SHELDON dataset—from small business innovation research (SBIR) awards to major defense acquisition programs—in a visual environment designed for discovery.
Ready to explore the data?
Get a personalized walkthrough of the SHELDON Knowledge Graph and see how it can accelerate your mission.